hpc:slurm
Table of Contents
Table of Contents
Slurm and job management
When we talk about cpu, we mean core of a cpu since all modern cpu are multi cores. So, one cpu = one core.
What is Slurm ?
According to Slurm official website :
Slurm is an open source, fault-tolerant, and highly scalable cluster management and job scheduling system for large and small Linux clusters. Slurm has three key functions.
- it allocates exclusive and/or non-exclusive access to resources (compute nodes) to users for some duration of time so they can perform work.
- it provides a framework for starting, executing, and monitoring work (normally a parallel job) on the set of allocated nodes.
- it arbitrates contention for resources by managing a queue of pending work.
Great, so what does it mean for the users of our HPC clusters ?
It means Slurm is the only way to being granted HPC resources. In order to request the resources you need to submit a job to Slurm or to ask it to allocate resources.
It is important to learn a few terms that are specific to Slurm :
- a resource: this may be cpu, gpu, running time (called wall time), memory, license or disk
- a job once resources are granted to you, your code is running on them and releases them when it finish. When you “submit a job”, you'll ask resources and your job will be put on waiting queue.
- a partitions determines on which resources your job will run
- a priority determine when you'll get access to a resource and your job will start
Resources
Before explaining more about Slurm jobs, it is important to understand to concept of partition and some other limits.
Partitions
What is a partition ?
A partition is a group of compute nodes accessible with some specific properties (such as maximum execution time, etc.).
- There are two main categories of partitions :
- public partitions are available for everybody on the clusters,
- private partitions are only available to their owners.
- When the HPC team buys compute nodes with UNIGE's funds, those nodes are 100% public which means they will be inside public partitions (
public-*).- Public partitions allow a maximum execution time of 4 days
- Public-short-* allows a maximum execution time of 1 hour, with a maximum of 6 cpu per jobs and 1 job running per user (multiple submit is allowed).
- When a research group buys compute nodes with their funds (private, FNS, etc.), those nodes will be inside both shared and private partitions.
- Private partitions give a higher priority to jobs (shorter waiting time) ;
- Private partitions also allow a maximum execution time of 7 days
- When the owner of the private partition is not using it, the nodes can be used by anyone else in the cluster since the nodes are shared in the shared partitions (
shared-*).- Hence, the (
shared-*) partitions contain all the cluster's nodes (public and private nodes) - Shared partitions allow a maximum execution time of 12 hours
Our clusters Baobab and Yggdrasil are heterogeneous, which means the nodes in a partition are not necessarily identical.
You can get a complete list of the nodes and their specifications in For advanced users - Compute nodes
Which partition for my job ?
This is a very important question, and choosing the right partition can save you (and others) a lot of time.
- Shared partions :
shared-cpu- for CPU jobs that need to run up to 12hshared-gpu- for GPU jobs that need to run up to 12hshared-bigmem- same asshared-cpu, but when you need a crazy amount of RAM (max. 12h )- N.B.
shared-*partition contain more nodes thanpublic-*(the sum of public and private nodes), but the maximum wall time is 12h.
- Public partitions:
public-cpu- for CPU jobs that need to run between 12h and 4 days (max. 4 days)public-gpu- for GPU jobs that need to run between 12h and 4 days (max. 4 days)public-bigmem- same aspublic-cpu, but when you need a crazy amount of RAM (max. 4 days)- N.B.
public-*partition contain less nodes thanshared-*, but the maximum wall time is 4 days.
- Special public partitions:
debug-cpu- to test your CPU jobs and make sure everything works fine (max. 15 min)debug-gpu- to test your GPU jobs and make sure everything works fine (max. 15 min)public-interactive-cpu- for interactive CPU jobs (max. of 6 cores for 8h)public-longrun-cpu- for CPU jobs that don't need much resources, but need a longer runtime time (max. of 2 cores for 14 days)public-short-cpufor CPU jobs that need to run 1h max and 6 CPU max (limited to 1 job running per user but multiple submits allowed)
- Private partitions:
- The number of CPU/GPU nodes in a private partition depends on the partition
- If none of your colleagues are using the private partition, max. waiting time is 12h
- For jobs that need to run for more than 4 days (max. 7 days)
You can read more about job priorities and waiting time in the Slurm Job priority section.
Partitions lists
The command sinfo shows you more details about the partitions you have access to (default time, etc.)
[root@admin1 ~]# sinfo
PARTITION                 AVAIL  TIMELIMIT  NODES  STATE NODELIST
debug-cpu*                   up      15:00      2   idle cpu[001-002]
debug-gpu                    up      15:00      1   idle gpu001
public-cpu                   up 4-00:00:00     77  alloc cpu[006-082]
public-bigmem                up 4-00:00:00      4   idle cpu[112-115]
public-gpu                   up 2-00:00:00      6   idle gpu[002-006,008]
shared-cpu                   up   12:00:00     33    mix cpu[005,084-111,116-119]
shared-cpu                   up   12:00:00     77  alloc cpu[006-082]
[...]
The default partition is
debug-cpu (see, there is as '*' in its name). If you want to use another one, you must explicitly specify it.
In the list of partitions (see below), the “Max mem per core” is the suggested value, but it is not enforced. Please refer to the Memory and CPU usage section for details about how to request a specific amount of memory. If you need more than 10GB RAM per core, you might want to use one of the *-bigmem partition.
Clusters partitions
As of 2020-11, the new partition naming is available on Baobab.
| Partition | Time Limit | Max mem per core |
|---|---|---|
| debug-cpu | 15 Minutes | full node memory |
| debug-gpu | 15 Minutes | full node memory |
| public-interactive-cpu | 8 hours | 10GB |
| public-longrun-cpu | 14 Days | 10GB |
| public-cpu | 4 Days | 10GB |
| public-gpu | 4 Days | 10GB |
| public-bigmem | 4 Days | half node memory |
| shared-cpu | 12 Hours | 10GB |
| shared-gpu | 12 Hours | 10GB |
| shared-bigmem | 12 Hours | 500GB |
All the compute nodes have 3GB of memory per core by default. Minimum resource is one core.
N.B. : no debug-gpu, nor public-gpu partitions on Baobab, as there are only private GPU nodes.
Private partitions
To avoid confusion, private partitions aren't detailed here.
| Partition | Time Limit | Max mem per core | default Mem Per core |
|---|---|---|---|
| private-<privatename> | 7 Days | full node memory | 3GB |
To see details about a given partition, go to the web page https://baobab.unige.ch and click on the “status” tab. If you belong in one of these groups, please contact us to request to have access to the correct partition as we have to manually add you.
Wall time
When you submit a job, you need to specify the estimated duration of your job.
The time formats accepted by Slurm are as follows:
minutes
minutes:seconds
hours:minutes:seconds
days-hours
days-hours:minutes
days-hours:minutes:seconds
Example:
1-12:30:25
Means: 1 day, 12 hour, 30 min and 25 seconds
Make sure you estimate the amount of time you correctly for your job and make sure the partition you use allows to run your code for this duration. Your job has more chance to start quickly if you ask less resources.
Memory
When you submit a job, the usable memory you have is 3GB per core. If you are running a job which requires more or less memory per core, you can specify it like this:
--mem-per-cpu=1000 # in MB
Even if you have requested a full node, you still need to specify how much memory you need:
--mem=60000 # 60'000 MB => 60 GB
This is even the case if you request a partition such as *-bigmem!
The value of 0 will request all the node's memory.
You can use
--mem=0 to ensure you use the entire memory of a node.
GPU
Currently on Baobab and Yggdrasil there are several nodes equipped with GPUs. To request a GPU, it's not enough to specify a partition with nodes having GPUs, you must as well specify how many GPUs and optionally the needed GPU type.
To specify how many GPU to request, use the option --gpus=n with n having a value between 1 and the maximum according to the table below.
You should also specify the type of GPU you want:
- ampere, high end architecture for multipurpose use
- titan, for single precision computation, like machine learning
- pascal, for double precision computation like physical simulations
- rtx, to accelerate machine learning, data science workflows and ray tracing
Example to request three titan cards: --gpus=titan:3.
You can find a detailed list of GPUs available on our clusters here : https://doc.eresearch.unige.ch/hpc/hpc_clusters#for_advanced_users
Resources :
CPU types
It's normally not important on which type of node your job is running. But there are some cases where it is important to be able to stick to a given kind of CPU or a certain generation of CPUs.
You can request for example to have only nodes with CPU E5-2660V0 :
srun --constraint=E5-2660V0
or
#SBATCH --constraint=E5-2660V0
Or you can specify that you want a node of generation V3 :
srun --constraint=V3
or
#SBATCH --constraint=V3
You can specify as well multiple constraints using logical or with the symbol |. For example if you don't want to use nodes of generation V1:
srun --constraint="V2|V3|V4|V5|V6"
or
#SBATCH --constraint="V2|V3|V4|V5|V6"
If you want a list of those specifications, please check : For advanced users - Compute nodes
Single thread vs multi thread vs distributed jobs
There are three job categories each with different needs:
| Job type | Number of cpu used | Examples | Keywords | Slurm |
|---|---|---|---|---|
| single threaded | one CPU | Python, plain R | - | |
| multi threaded | all the CPUs of a compute node (best case scenario) | Matlab, Stata-MP | OpenMP, SMP | --cpus-per-tasks |
| distributed | can spread tasks on multiple compute nodes | Palabos OpenFOAM | OpenMPI, workers | --ntasks |
There are also hybrid jobs, where each tasks of such a job behave like a multi-threaded job. This is not very common and we won't cover this case.
In slurm, you have two options for asking CPU resources:
--cpus-per-tasks: this will specify that you want more than one CPU per task.--ntasks: this will launch n time your job. ONLY specify a value bigger than one if your job knows how to handle multitasking properly. For example OpenMPI job can benefit of this option. If your job doesn't handle this option correctly, it will be launched n time doing strictly the same things, this is not what you want and will wait resources and create corrupted output files.
Submitting jobs
After connecting to the login node, you need to submit a job to Slurm to request computing resources. You can request it in 3 ways :
| method | execute job | blocking command | support job array | batch script needed |
|---|---|---|---|---|
| salloc | no | yes | no | no |
| srun | yes, single one | yes | no | no |
| sbatch | yes | no | yes | yes (or -w option) |
By blocking command, we mean that you need to keep your terminal open during the whole process. If you close it, your job will finish.
An “sbatch” script is a Bash script with special instructions for Slurm.
Do not execute directly the sbatch script as bash script, but submit it using
sbatch (otherwise your script will be launched on the login node and this is forbidden):
[sagon@login2 slurm] $ sbatch example.sh
Submitted batch job 40721231
The number 40721231 is the jobid that is a uniq number. You can use it later for reporting, see logs or cancel for example.
Whatever method you use, you need to pass some arguments (such as how many CPU you need, which Slurm partition to use, how long your script will run, how to execute your code). Slurm will then add your job in a queue with other users' jobs, and find the fastest way to provide the resources you asked for. When the resources are available, your job will start.
There are various possibilities to submit a job on the cluster. We have detailed the most common usage below.
If you belong to more than one account, you should specify which account should be used with the option
--account=<account>
Batch mode (sbatch)
To use the batch mode, you need a sbatch script. Here is an Example of an sbatch script my_sbatch.s with #SBATCH directives :
#!/bin/sh
#SBATCH --job-name jobname            # this is a parameter to help you sort your job when listing it
#SBATCH --error jobname-error.e%j     # optional. By default a file slurm-{jobid}.out will be created
#SBATCH --output jobname-out.o%j      # optional. By default the error and output files are merged
#SBATCH --ntasks 1                    # number of tasks in your job. One by default
#SBATCH --cpus-per-task 1             # number of cpus for each task. One by default
#SBATCH --partition debug-cpu         # the partition to use. By default debug-cpu
#SBATCH --time 15:00                  # maximum run time.

module load my_software               # load a specific software using module, for example Python

srun my_software                      # run your software
To submit your job proceed as follows:
[sagon@login1 ~]$ sbatch example.sh
Submitted batch job 53697
The job number can be useful if you want to see the status of the job on the queue of kill it for example.
To have a list of all options, please check Slurm documentation - sbatch
You can submit a batch job either with the help of a script or directly by specifying the options on the command line. The recommended way to use options for sbatch is to add them directly in the script as in the previous example.
Here are some examples to illustrate the second possibilities.
A simple example to launch a batch job my_sbatch.sh using 16 cpus on the default partition:
sbatch --ntasks=16 my_sbatch.sh
If not specified, the default partition is
debug-cpu and the the default number of cpus per task is 1
Launch a job specifying the partition “shared-cpu” (see Partitions and limits section) and max execution time:
sbatch --ntasks=8 --partition=shared-cpu --time=0-00:05:00 my_sbatch.sh
You will have more chance to have your job quickly scheduled if you specify an accurate max execution time (i.e. not the permitted maximum).
Monothreaded jobs
Click here for job type comparison.
When you submit a job on the clusters, the minimum resources that are allocated to you is a one cpu. As the node may be shared with other users, it is wise to specify the amount of memory you need per core. If you don't, the default memory allocated is 3GB per core.
Let's say you want to launch one job that needs 1GB per core. Your sbatch script is named example.sh
#!/bin/bash

#SBATCH --partition=public-cpu
#SBATCH --time=05:00
#SBATCH --ntasks=1
#SBATCH --mem-per-cpu=1000 # in MB

srun ./yourprog
To submit your job do as follows:
[sagon@login1 ~]$ sbatch example.sh
Submitted batch job 53697
The number you get is the jobid.
Adapt this example to fit your needs. If you need to scale this solution to a bigger number of similar tasks, see the Job array section.
Multithreaded jobs
Click here for job type comparison.
When you have a program that needs more than one core per task (openMP, STATA etc), you can adapt the Monothreaded jobs example by adding one line:
#SBATCH --cpus-per-task=x
where x is between 1 and 128. We have only a couple of AMD nodes with 128 cores. If you request a high number of cpus per task, be sure that you need it as you may have to wait many days for them to be available.
If you want to use all the cores of a node, but you don't know in advance the characteristic of the node, you can use this sbatch script:
#!/bin/sh
#SBATCH --job-name=test
#SBATCH --time=00:15:00
#SBATCH --partition=public-cpu
#SBATCH --output=slurm-%J.out
#SBATCH --exclusive
#SBATCH --ntasks=1

# We want to have a node with minimum
# 2 sockets, 4 cores per socket and 1 thread per core
# nb_cores = 2 * 4 * 1 = 8 cores
# if you want more cores, you can increase the number of cores per socket to
# 6 or 8 to have 12 or 16 cores.
#SBATCH --extra-node-info=2:4:1

We want to have at least 12GB RAM on this node
#SBATCH --mem=12000

# run one task which use all the cpus of the node
srun --cpu_bind=mask_cpu:0xffffffff ./mySoft
Distributed jobs
When you want to distribute your jobs across nodes, your software will probably use an MPI implementation such as OpenMPI or Intel.
To specify the number of MPI workers, you need to specify the number of tasks in slurm.
--ntasks-per-node: maximum number of tasks per node. Can be used in conjunction with --ntasks.
-n, --ntasks=<number>: number of workers in total
-N, --nodes=<minnodes[-maxnodes]>: number of nodes allocated to this job
You can have as well a hybrid job requiring tasks and cpus (for OpenMPI + OpenMP for example).
If you request for example 20 tasks and 1 CPU per task, your job may be executed by one compute node having 20 cpus if available or may be spread across any number of compute nodes. The issue may be that the compute nodes are shared with other jobs and not from the same generation.
To circumvent this, you can specify the cpu type you want, but you'll have more wait time.
You may as well want to specify the --exclusive flag to be sure that your compute node won't be shared
with other jobs. In this case, please do not specify the number of compute node or you may waste resources.
You may as well be interested by the distribution parameter.
--distribution: Specify alternate distribution methods for remote processes.
If you need more details, please consult the sbatch man page.
If you want to compile your software against MPI, it is very important not to compile using directly gcc, icc or similar commands,
but rather rely on the wrappers mpicc, mpic++, mpicxx or similar ones provided by
module.
Remember that you need to load the same module at runtime as well.
See here for more information about the toolchains
GPGPU jobs
When we talk about GPGPU we mean using a GPU to perform calculation, not for visualisation.
You can see on this table How our clusters work all the GPUs models we have on the cluster. You may notice that we have a very wide range of GPU models, from low end to high end. It is important to select the correct GPU model to avoid to waste resources. The important characteristics of a GPU are:
- on board memory in GB
- simple precision vs double precision for float calculation
- compute capability
Specify the memory needed. For example, request one GPU that has 10G at least.
srun --gres=gpu:1,VramPerGpu:10G
If you just need a GPU and you don't care of the type, don't specify it. You'll get the lower model available.
#SBATCH --gpus=1
Example to request two double precision GPU model:
#!/bin/sh
#SBATCH --partition=shared-gpu
#SBATCH --gpus=2
#SBATCH --constraint=DOUBLE_PRECISION_GPU

srun nvidia-smi
It's not possible to put two types in the GRES request, but you can ask for specific compute capability, for example you want to request any GPU model with compute capability bigger or equal to 7.5:
Example
#!/bin/sh
#SBATCH --partition=shared-gpu
#SBATCH --gpus=1
#SBATCH --constraint="COMPUTE_CAPABILITY_7_5|COMPUTE_CAPABILITY_8_0|COMPUTE_CAPABILITY_8.6|"
Example of script (see also https://gitlab.unige.ch/hpc/softs/tree/master/c/cuda ):
#!/bin/env bash

#SBATCH --partition=shared-gpu
#SBATCH --time=01:00:00
#SBATCH --gpus=titan:1

module load CUDA

# see here for more samples:
# /opt/cudasample/NVIDIA_CUDA-8.0_Samples/bin/x86_64/linux/release/

# if you need to know the allocated CUDA device, you can obtain it here:
echo $CUDA_VISIBLE_DEVICES

srun deviceQuery
If you want to see what GPUs are in use in a given node:
scontrol -d show node gpu002
[...]
Gres=gpu:titan:3
GresUsed=mic:0,gpu:titan:3(IDX:0-2)
[...]
In this case, this means that node gpu002 has three Titan cards, and all of them are allocated.
Interactive jobs
If you need to perform some debug/tests or if your software requires a graphical interface,
you can start an interactive session on a compute node.
For example, let's say you want to start a session on the debug-cpu partition for a duration of
15 minutes, using 2 CPUs:
[sagon@login2 ~]$ salloc -n1 -c2 --partition=debug-cpu --time=15:00 --x11
When the resources are allocated to you, you can see the login prompt change to reflect that you are using a compute node and not the login node:
[sagon@nodexxx ~]$
When done, you can stop the session like this:
[sagon@nodexxx ~]$ exit
Adding the option
--x11 will allow you to submit graphical job
For interactive programs, you might want to use the
public-interactive-cpu partition (Which partition for my job)
Job array
Slurm supports natively the notion of job arrays. A job array is useful when you have a lot of the same jobs to launch and you just want to give a different parameter to every job.
Here is an example for launching n time a monothreaded job.
The following sbatch script my_job_array.sh is used and the variable ${SLURM_ARRAY_TASK_ID} shows the taks ID in the job array:
#!/bin/bash

#SBATCH --partition=shared-cpu
#SBATCH --time=00:10:00
#SBATCH --cpus-per-task=1
#SBATCH --ntasks=1
#SBATCH --mem-per-cpu=1000 # in MB
#SBATCH -o myjob-%A_%a.out

srun echo "I'm task_id " ${SLURM_ARRAY_TASK_ID} " on node " $(hostname)
When you want to execute a job array, use the --array option. You may specify how many cores ONE instance of your array needs with --ntasks if you are using MPI or with --cpus-per-task otherwise. You must specify the array size and offset by specifying the start and stop of the array index.
N.B. The maximum size of an array is currently set to 10 000.
We encourgae you to limit the maximum number of simultaneously running tasks from the job array may be specified using a “%” separator.
For example “- -array=0-15%4” will limit the number of simultaneously running tasks from this job array to 4
Example to launch an array of 100 jobs, each one using one core:
sbatch --array=1-100%4 my_job_array.sh
The max number %100 sems to be a good limit :)
Advanced usage
Job dependency
Slurm can handle job dependencies in various way.
Some of the dependency features available in Slurm (cf. man sbatch)
after:job_id[[+time][:jobid[+time]...]]afterany:job_id[:jobid...]afternotok:job_id[:jobid...]afterok:job_id[:jobid...]expand:job_idsingleton
Example to submit multiple batch jobs that are dependent from each other. The dependent job will only start when the previous one terminated with success:
[sagon@login2 ~]$ sbatch  pre_process.bash
Submitted batch job nnnnn
[sagon@login2 ~]$ sbatch --dependency=afterok:nnnnn do_work.bash
Submitted batch job 12346
N.B. in this example, the first submitted job is given the job ID “nnnnn”
(in real life, it will be a number), and the second one depends on it thanks to the option
--dependency=afterok:nnnnn. You obviously need to replace nnnnn with the job ID returned by Slurm.
You can see here an example with singleton used to restart a job when time limit is reached.
Master/Slave
You can run different job step in an allocation. This may be useful in case of a master/slave program for example.
For example, if you want to launch a master program on core 0 and 4 slaves jobs on cores 1-4:
[sagon@login2 ~]$ cat master.conf
#TaskID Program Arguments
0 masterprogramm
1-4 slaveprogramm --rank=%0

[sagon@login2 ~]$ srun --ntasks=5 --multi-prog master.conf
Use %t and %o to obtain respectively the task id and offset.
Checkpoint
A checkpoint allows you to pause/stop a program and to restart it from the “saved” point. This is usually done by saving your progress to a file, and your program can be restarted from that file.
Not all programs implement checkpointing, so you have to check if this is an option for you.
If you can use checkpoints, this can be interesting :
- to save your progress and avoid starting all over again if your job fails.
- to run a time-consuming task in multiple short jobs to obtain resources faster
- instead of requesting a job for 4 days, you could execute it by running multiple 12h jobs consecutively. This could decrease your waiting time to obtain the resources (as it's usually faster to get a slot of 12h than it is for 4 days).
Please check this post :
Reservation
to request for reservation; contact the HPC team following the instruction https://doc.eresearch.unige.ch/hpc/start > contact the hpc team by email
list reservation:
(baobab)-[alberta@login2 ~]#scontrol show res
Use reservation via srun:
(baobab)-[alberta@login2 ~]# srun --reservation <reservation_name> hostname
Use reservation via script sbatch:
#SBATCH --reservation <reservation_name>
#!/bin/bash

#SBATCH --job-name=test_unitaire
#SBATCH --reservation test
srun hostname
Job monitoring
If you want to get an estimated start time for your job, you can use --test-only :
srun --test-only -n100 -p public-cpu -t 10 hostname
To see the queue :
squeue
Add the -u <username> to see a list of all your job together with the node they are scheduled on and the reason why they might not be starting.
Add the –start flag to obtain the scheduled time of when your job should start. 1)
squeue -u $USER --start
To get an estimation of when your job is scheduled to start :
scontrol show jobid 5543
Those commands give an estimation. Sometimes the waiting time will be longer, sometimes it will be shorter
Email notification of job events
When a determined event occurs in your job's life, it is possible to receive an email to the address used during your Account registration :
--mail-type=<type> BEGIN, END, FAIL, REQUEUE, and ALL (any state change).
Those options can be used with sbatch and srun.
If your job get killed, one of the reason could be that you have used too much memory. To check if it's the case, you can have a look at dmesg.
For instance :
dmesg
Memory cgroup out of memory: Kill process 62310 (cavity3d) score 69 or sacrifice child
The email you receive contains important information about why your job failed for instance, but it's not always easy to read it. For example in this excerpt, you need to look inside the big block at th beginning to find the Reason PartitionTimeLimit (meaning the requested time is too long for the requested partition) :
   [...]
 $ scontrol show Job=123456
JobId=123456 JobName=/home/users/b/brero/testFailed.sh
   [...]
   JobState=PENDING Reason=PartitionTimeLimit Dependency=(null)
   Requeue=1 Restarts=0 BatchFlag=1 Reboot=0 ExitCode=0:0
   RunTime=00:00:00 TimeLimit=5-13:20:00 TimeMin=N/A
   [...]
Memory and CPU usage
You can see how much memory/cpu your job is using if it is still running using sstat. :
sstat --format=AveCPU,MaxRSS,JobID,NodeList -j <yourjobid>
If your job is no longer running, you can use sacct to see stats about. :
sacct --format=Start,AveCPU,State,MaxRSS,JobID,NodeList,ReqMem --units=G -j <yourjobid>
If you want other information please see the sacct manpage.
Energy usage
CPUs
You can see the energy consumption of your jobs on Yggdrasil (Baobab soon). The energy is shown in Joules using sacct.
(yggdrasil)-[root@admin1 state] (master *)$ sacct  --format=Start,State,JobID,ConsumedEnergy,ConsumedEnergyRaw --units=k -j 28478878
              Start      State JobID        ConsumedEnergy ConsumedEnergyRaw
------------------- ---------- ------------ -------------- -----------------
2023-10-12T09:48:28  COMPLETED 28478878             43.13K             43127
2023-10-12T09:48:28  COMPLETED 28478878.ex+         43.13K             43127
2023-10-12T09:48:28  COMPLETED 28478878.0           43.11K             43109
It is working only for Intel nodes (at least for the moment). Only in the case of an exclusive job allocation does this value reflect the job's real energy consumption.
GPUs
If you are interested by the power usage of a GPU card your job is using, you can issue the following command while your job is running on a GPU node:
(baobab)-[root@gpu002 ~]$ nvidia-smi dmon --select p --id 0

# gpu    pwr  gtemp  mtemp
# Idx      W      C      C
    0     63     55      -
    0     59     55      -
    0     62     55      -
Job history
You can see your job history using sacct:
[sagon@master ~] $ sacct -u $USER -S 2021-04-01
       JobID    JobName  Partition    Account  AllocCPUS      State ExitCode
------------ ---------- ---------- ---------- ---------- ---------- --------
45517641        jobname  debug-cpu   rossigno          1     FAILED      2:0
45517641.ba+      batch              rossigno          1     FAILED      2:0
45517641.ex+     extern              rossigno          1  COMPLETED      0:0
45517641.0            R              rossigno          1     FAILED      2:0
45518119        jobname  debug-cpu   rossigno          1  COMPLETED      0:0
45518119.ba+      batch              rossigno          1  COMPLETED      0:0
45518119.ex+     extern              rossigno          1  COMPLETED      0:0
Report and statistics with sreport
To get reporting about your past jobs, you can use sreport (https://slurm.schedmd.com/sreport.html).
Here are some examples that can give you a starting point :
To get the number of jobs you ran (you ⇔ $USER) in 2018 (dates in yyyy-mm-dd format) :
[brero@login2 ~]$ sreport job sizesbyaccount user=$USER PrintJobCount start=2018-01-01 end=2019-01-01

--------------------------------------------------------------------------------
Job Sizes 2018-01-01T00:00:00 - 2018-12-31T23:59:59 (31536000 secs)
Units are in number of jobs ran
--------------------------------------------------------------------------------
  Cluster   Account     0-49 CPUs   50-249 CPUs  250-499 CPUs  500-999 CPUs  >= 1000 CPUs % of cluster
--------- --------- ------------- ------------- ------------- ------------- ------------- ------------
   baobab      root           180            40             4            15             0      100.00%
You can see how many jobs were run (grouped by allocated CPU). You can also see we specified an extra day for the end date end=2019-01-01 in order to cover the whole year :
Job Sizes 2018-01-01T00:00:00 - 2018-12-31T23:59:59''
You can also check how much CPU time (seconds) you have used on the cluster between since 2019-09-01 :
[brero@login2 ~]$ sreport cluster AccountUtilizationByUser user=$USER start=2019-09-01 -t Seconds
--------------------------------------------------------------------------------
Cluster/Account/User Utilization 2019-09-01T00:00:00 - 2019-09-09T23:59:59 (64800 secs)
Usage reported in CPU Seconds
--------------------------------------------------------------------------------
  Cluster         Account     Login     Proper Name     Used   Energy
--------- --------------- --------- --------------- -------- --------
   baobab        rossigno     brero   BRERO Massimo     1159        0
In this example, we added the time -t Seconds parameter to have the output in seconds. Minutes or Hours are also possible.
Please note :
- By default, the CPU time is in Minutes
- It takes up to an hour for Slurm to upate this information in its database, so be patient
- If you don't specify a start, nor an end date, yesterday's date will be used.
- The CPU time is the time that was allocated to you. It doesn't matter if the CPU was actually used or not. So let's say you ask for 15min allocation, then do nothing for 3 minutes then run 1 CPU at 100% for 4 minutes and exit the allocation, then 7 minutes will be added to your CPU time.
Tip : If you absolutely need a report including your job that ran on the same day, you can override the default end date by forcing tomorrow's date :
sreport cluster AccountUtilizationByUser user=$USER start=2019-09-01 end=$(date --date="tomorrow" +%Y-%m-%d) -t seconds
Other tools
spart
spart 2) is a tool to check the overall partition usage/description.
More info in this post.
[brero@login2 ~]$ spart
            QUEUE STA   FREE  TOTAL RESORC  OTHER   FREE  TOTAL ||   MAX    DEFAULT    MAXIMUM  CORES   NODE
        PARTITION TUS  CORES  CORES PENDNG PENDNG  NODES  NODES || NODES   JOB-TIME   JOB-TIME  /NODE MEM-GB
        debug-EL7   *     32     64  50114      1      2      4 ||     2    15 mins    15 mins     16     64
         mono-EL7        120    784   4197     43      0     49 ||     -     1 mins     4 days     16     64
     parallel-EL7        120    784   2108     18      0     49 ||     -     1 mins     4 days     16     64
       shared-EL7        326   3572    734    489      1    224 ||     -     1 mins    12 hour     12     40
  mono-shared-EL7        326   3572 144348    615      1    224 ||     -     1 mins    12 hour     12     40
       bigmem-EL7         14     16     66      0      0      1 ||     1     1 mins     4 days     16    256
shared-bigmem-EL7         63    212    820      0      1     10 ||     -     1 mins    12 hour      8    256
   shared-gpu-EL7        415    484     16     36      3     12 ||     -     1 mins    12 hour     12    128
        admin-EL7         16     16      0      0      1      1 ||     -     1 mins     7 days     16     64

                  YOUR YOUR YOUR YOUR
                   RUN PEND OTHR TOTL
   COMMON VALUES:    0    0    0    0
pestat
pestat 3) is another tool to check cluster usage, this time focusing on single nodes
More info in this post.
[brero@login2 ~]$ pestat
Hostname       Partition     Node Num_CPU  CPUload  Memsize  Freemem  Joblist
                            State Use/Tot              (MB)     (MB)  JobId User ...
  gpu002 shared-gpu-EL7+      mix   6  12    8.29*   257820   231499  39803837 krivachy 39806932 salamda0 39795512 blonde0 39795511 blonde0 39795510 blonde0 39795480 blonde0
  gpu004  shared-gpu-EL7      mix   6  20    7.27*   128820   102173  39795515 blonde0 39795516 blonde0 39795485 blonde0 39795481 blonde0 39795482 blonde0 39795499 blonde0
  gpu005  shared-gpu-EL7      mix   5  20    6.05*   128820    97620  39795513 blonde0 39795463 blonde0 39795464 blonde0
  [...]
 node001      debug-EL7*     idle   0  16    8.64*    64000    47239
 node002      debug-EL7*    alloc  16  16    7.63*    64000    16393  39772071 gonzalcr
 node003      debug-EL7*    alloc  16  16   11.16*    64000    18610  39772072 gonzalcr
 node004      debug-EL7*    drain*  0  16    0.01     64000    62061
 node005        mono-EL7     drng*  8  16    2.52*    64000    38015  39802885 vie
 node007    parallel-EL7    alloc  16  16   16.03     64000    53761  39524658 robinsh8
 node008        mono-EL7      mix   8  16    2.13*    64000    53388  39802883 vie
 node009    parallel-EL7    alloc  16  16    0.01*    64000    54509  39524658 robinsh8
 node010    parallel-EL7    alloc  16  16    0.01*    64000    49796  39524658 robinsh8
 node011        mono-EL7      mix   8  16    1.53*    64000    48417  39802889 vie
seff
seff is tool get a Slurm job efficiency report
[sagon@login2 ~] $ seff 30455298
Job ID: 30455298
Cluster: baobab
User/Group: savchenk/hpc_users
State: COMPLETED (exit code 0)
Cores: 1
CPU Utilized: 00:00:01
CPU Efficiency: 0.77% of 00:02:10 core-walltime
Job Wall-clock time: 00:02:10
Memory Utilized: 34.16 MB
Memory Efficiency: 1.14% of 2.93 GB
HDF5 profiling plugin
The HDF5 plugin can help profile your jobs 4).
Official documentation :
The HDF5 files will be saved as /opt/cluster/slurm/hdf5/${USERNAME}/${JOBID}.h5.
You can analyse the HDF5 files directly on the login node via HDFView 5).
Cancel jobs
If you realise you made a mistake in your code or in your sbatch script, you can cancel your pending jobs or your running job (only yours).
If you want to cancel a particular job, you need to know its job id (you can see it on the web interface or using squeue).
Cancelling a job using its job id:
scancel <jobid>
Cancel a job and send a custom signal (for example to force the binary to generate a checkpoint):
scancel --signal=signal_name
You can read this topic Gracefully quit when job is cancelled
Cancel all the jobs belonging to one user that are in a pending state:
scancel --user=meyerx --state=pending
Job priorities
How is the priority of a job determined ?
HPC users often wonder how is the job priority calculated by Slurm.
On our clusters, the priority is obtained in general by four criteria, and each criterion has a different weight.
    partition : 15000
    age: 300
    jobsize: 1000
    fairshare: 30000
- The
partitioncriterion is always the same for a given user on a given partition. It is higher if you use a private partition.- For example, if you submit a job to the partition
shared-cpuyou’ll get a priority of 3750 for thepartitioncriterion. - However, this
partitioncriterion may have a multiplier, ie : if you use a private partitions. - For example, if a user submit a job on a private partition, the multiplication factor is 4 and he will have a priority of 15000 for the
partitioncriterion. - The reason for this is because private nodes are simultaneously part of multiple partitions : a private partition and
shared-cpupartition. The multiplier ensures that the people with access to private partitions have a faster access to their private node.
- The
agecriterion starts to increase as soon as the job is submitted. Hence, the priority will slowly increase with time. This is used to prevent a job with a low priority to stay in the queue for ages. - The
jobsizecriterion is here to favour big jobs, but the weigh is very low unless you submit a very big job. - The
fairsharecriterion is based on the past usage of the user. If you use the cluster a lot, yourfairsharecriterion will decrease. Every 2 weeks, half of your past usage is “forgotten” by Slurm.
You can see how the priority of a job and see how it is calculated with the sprio command. Example
- for a public partition (partition weight 3750)
[root@master ~]# sprio -j xxx JOBID PARTITION PRIORITY SITE AGE FAIRSHARE JOBSIZE PARTITION QOS xxx mono-shar 3810 0 6 53 2 3750 0 - for a private partition (partition weight 15000)
[root@master ~]# sprio  -j xxx
          JOBID PARTITION   PRIORITY       SITE        AGE  FAIRSHARE    JOBSIZE  PARTITION        QOS
       yyy      wesolowsk      19590          0          1       4586          4      15000          0
       zzz      dpnc-EL7       21288          0          0       6297          2      15000          0
The priority is calculated by summing the values of all four criteria (it's actually a little more complex than that, as the priority returned by sprio isn't an exact sum, but you get the general idea). The bigger the priority, the higher is your chance to be scheduled compared to a job with a lower priority. The partition and fairshare criteria have then the strongest impact on the total priority calculation.
If you want to learn more about it, you can check this presentation :
- Slurm Priority, Fairshare and Fair Tree (might differ from how we do things on UNIGE clusters)
Priority vs. waiting time
Please also remember that the priority of a job is one thing, but the actual waiting time is another.
- Your priority is calculated regardless of the amount of resources you request for a job.
- If you request a large amount of resources, it might take more time for Slurm to provide those resources (the time to wait until they are free).
- Hence, asking for more or less memory won't change the priority, but asking for more resources might affect the waiting time.
- So it is better to request as little resources as possible if you want increase your chances to be scheduled quickly.
The waiting time is a pessimistic estimation and is based on the maximum time a job is announced to take. If you don't use the #SBATCH –time directive in your sbatch script, the default time for a job is given by the maximum time limit of the partition (12h, 4 day or 7 days depending on the partition). This implies that a job with a maximum run time of 4 days will be scheduled to take the whole 4 days and other jobs will be scheduled to run after it has finish. However if the job only take 10 hours the other jobs can start sooner. 6)
However, if you are using a shared-* partition, bear in mind that a new job on a private partition might “cut in line” as they have a higher priority.
If you are requesting for example 12h00 of wall-time and 16 cores, and another user is asking for a wall-time of 1 minute and 1 core, this job will most likely be scheduled before your job thanks to the backfill mechanism even if you job has a higher priority.
The total number of running jobs of a given user doesn’t change the priority of a job. But if the user uses the cluster a lot (especially a lot in a short time), then his/her fairshare criterion will decrease.
Please also check this post : HPC Community - Job priority explanation
Backfill mechanism
The priority is determined by various factors like the usage history, job age and its size.
The scheduler use a backfill to maximize the cluster usage.
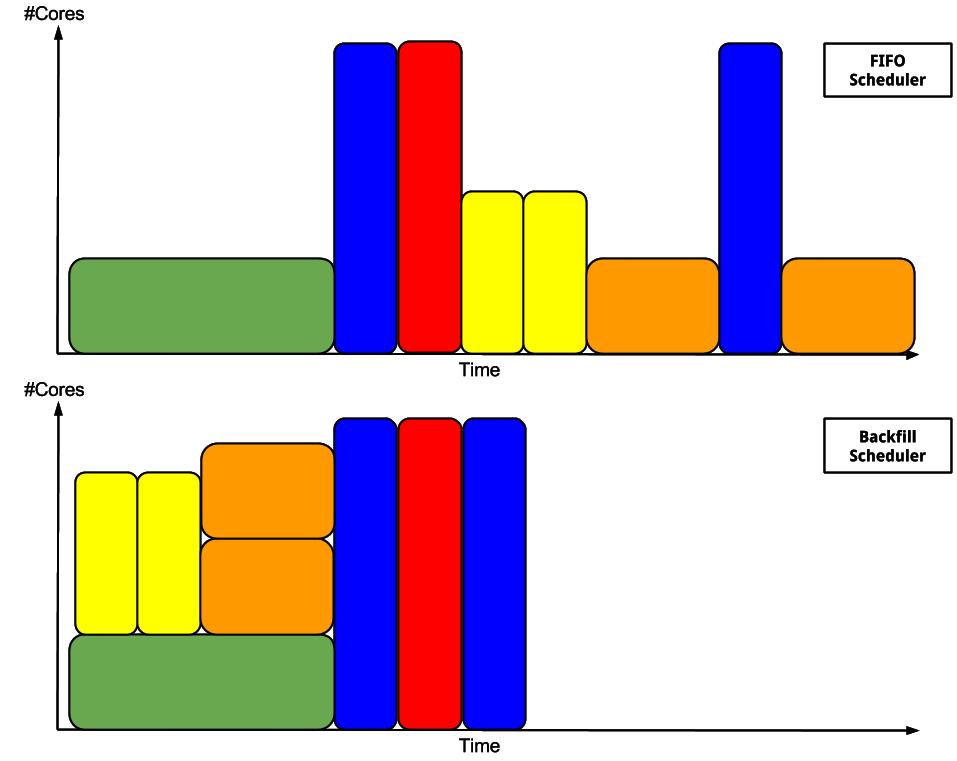
To benefit of the backfill allocation, you can specify a minimum and a maximum execution time when you submit a job. If the resources for the max execution time are not available, the scheduler will try to decrease the execution time until it reaches the minimum execution time. In the following example, we submit a job specifying that we want ideally a two days execution time with a one day minimum:
srun --tasks=128 --time-min=1-00:00:00 --time=2-00:00:00 --partition shared-cpu myjob
Attention
Warning : Be sure that you have some kind of checkpointing activated as your job will be terminated between the min and max execution time.
hpc/slurm.txt · Last modified: 2024/02/01 10:29 by Adrien Albert
Except where otherwise noted, content on this wiki is licensed under the following license: CC Attribution 4.0 International
